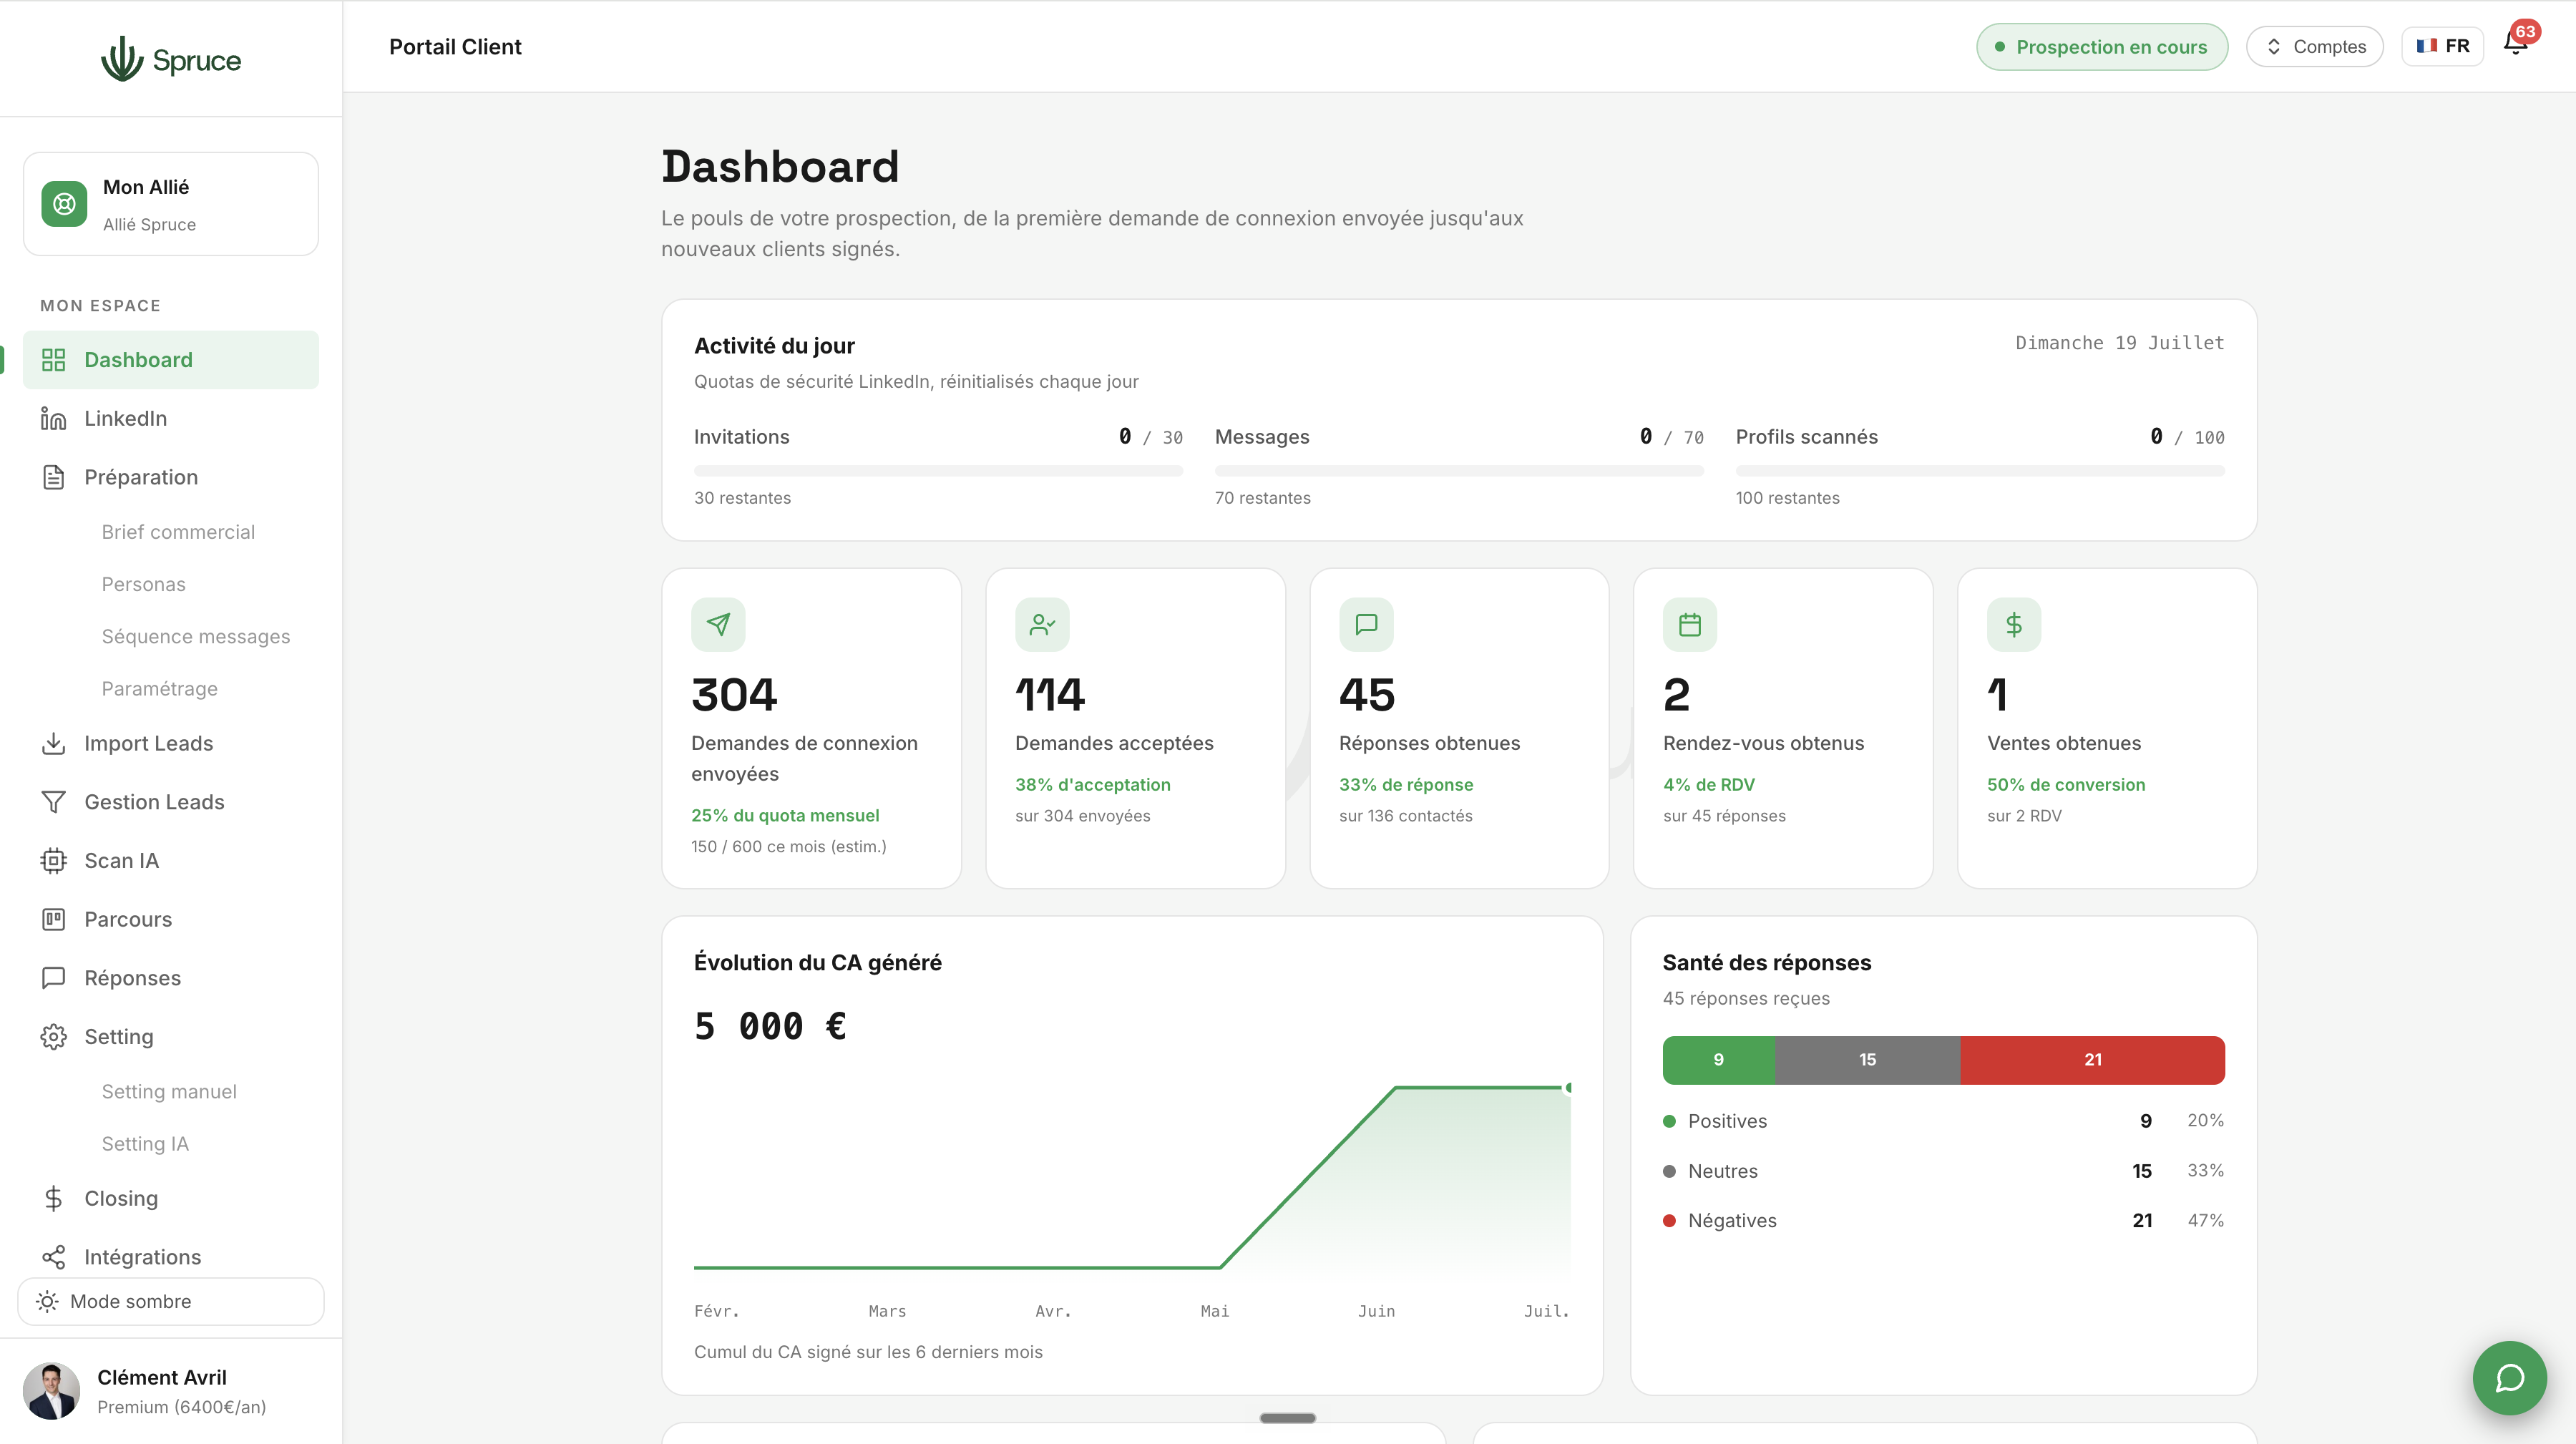
Dashboard
Key metrics, performance charts, and goal tracking. The more precise your sales tracking, the more this data helps you analyze and improve your prospecting. All at a glance.
The Dashboard is the entry point for your sales overview: at a glance, you see exactly where your prospecting stands, from the first import to the latest sale.
You'll find your key metrics in real time: number of prospects imported, qualification rate, reply rate, meetings booked, opportunities in progress, and revenue generated.
Performance charts let you compare your results period over period, helping you identify what's working and adjust your strategy accordingly.
You can also track your sales goals directly from the Dashboard, and export your data to plug into your own reporting tools if needed.
The more precise your sales tracking is (especially via Closing), the more reliable and useful this data becomes for running your business day to day.
Yes, all the data displayed reflects the current state of your prospecting and sales, with no sync delay.
The Dashboard displays your business's key indicators by default. For specific reporting needs, you can export your data.
Yes, period-over-period comparison lets you track how your metrics evolve over time.
Access depends on the permissions defined in your Spruce Account Settings.
Question template
Réponse template.
Rejoignez 150+ clients qui prospectent intelligemment avec Spruce.
Plan Essentiel offert pendant 14 jours résiliable à tout moment